Gatepost Poem Frequency and Locations Timeline: 1-20 Scatter Plot
Media
Title
Gatepost Poem Frequency and Locations Timeline: 1-20 Scatter Plot
Description
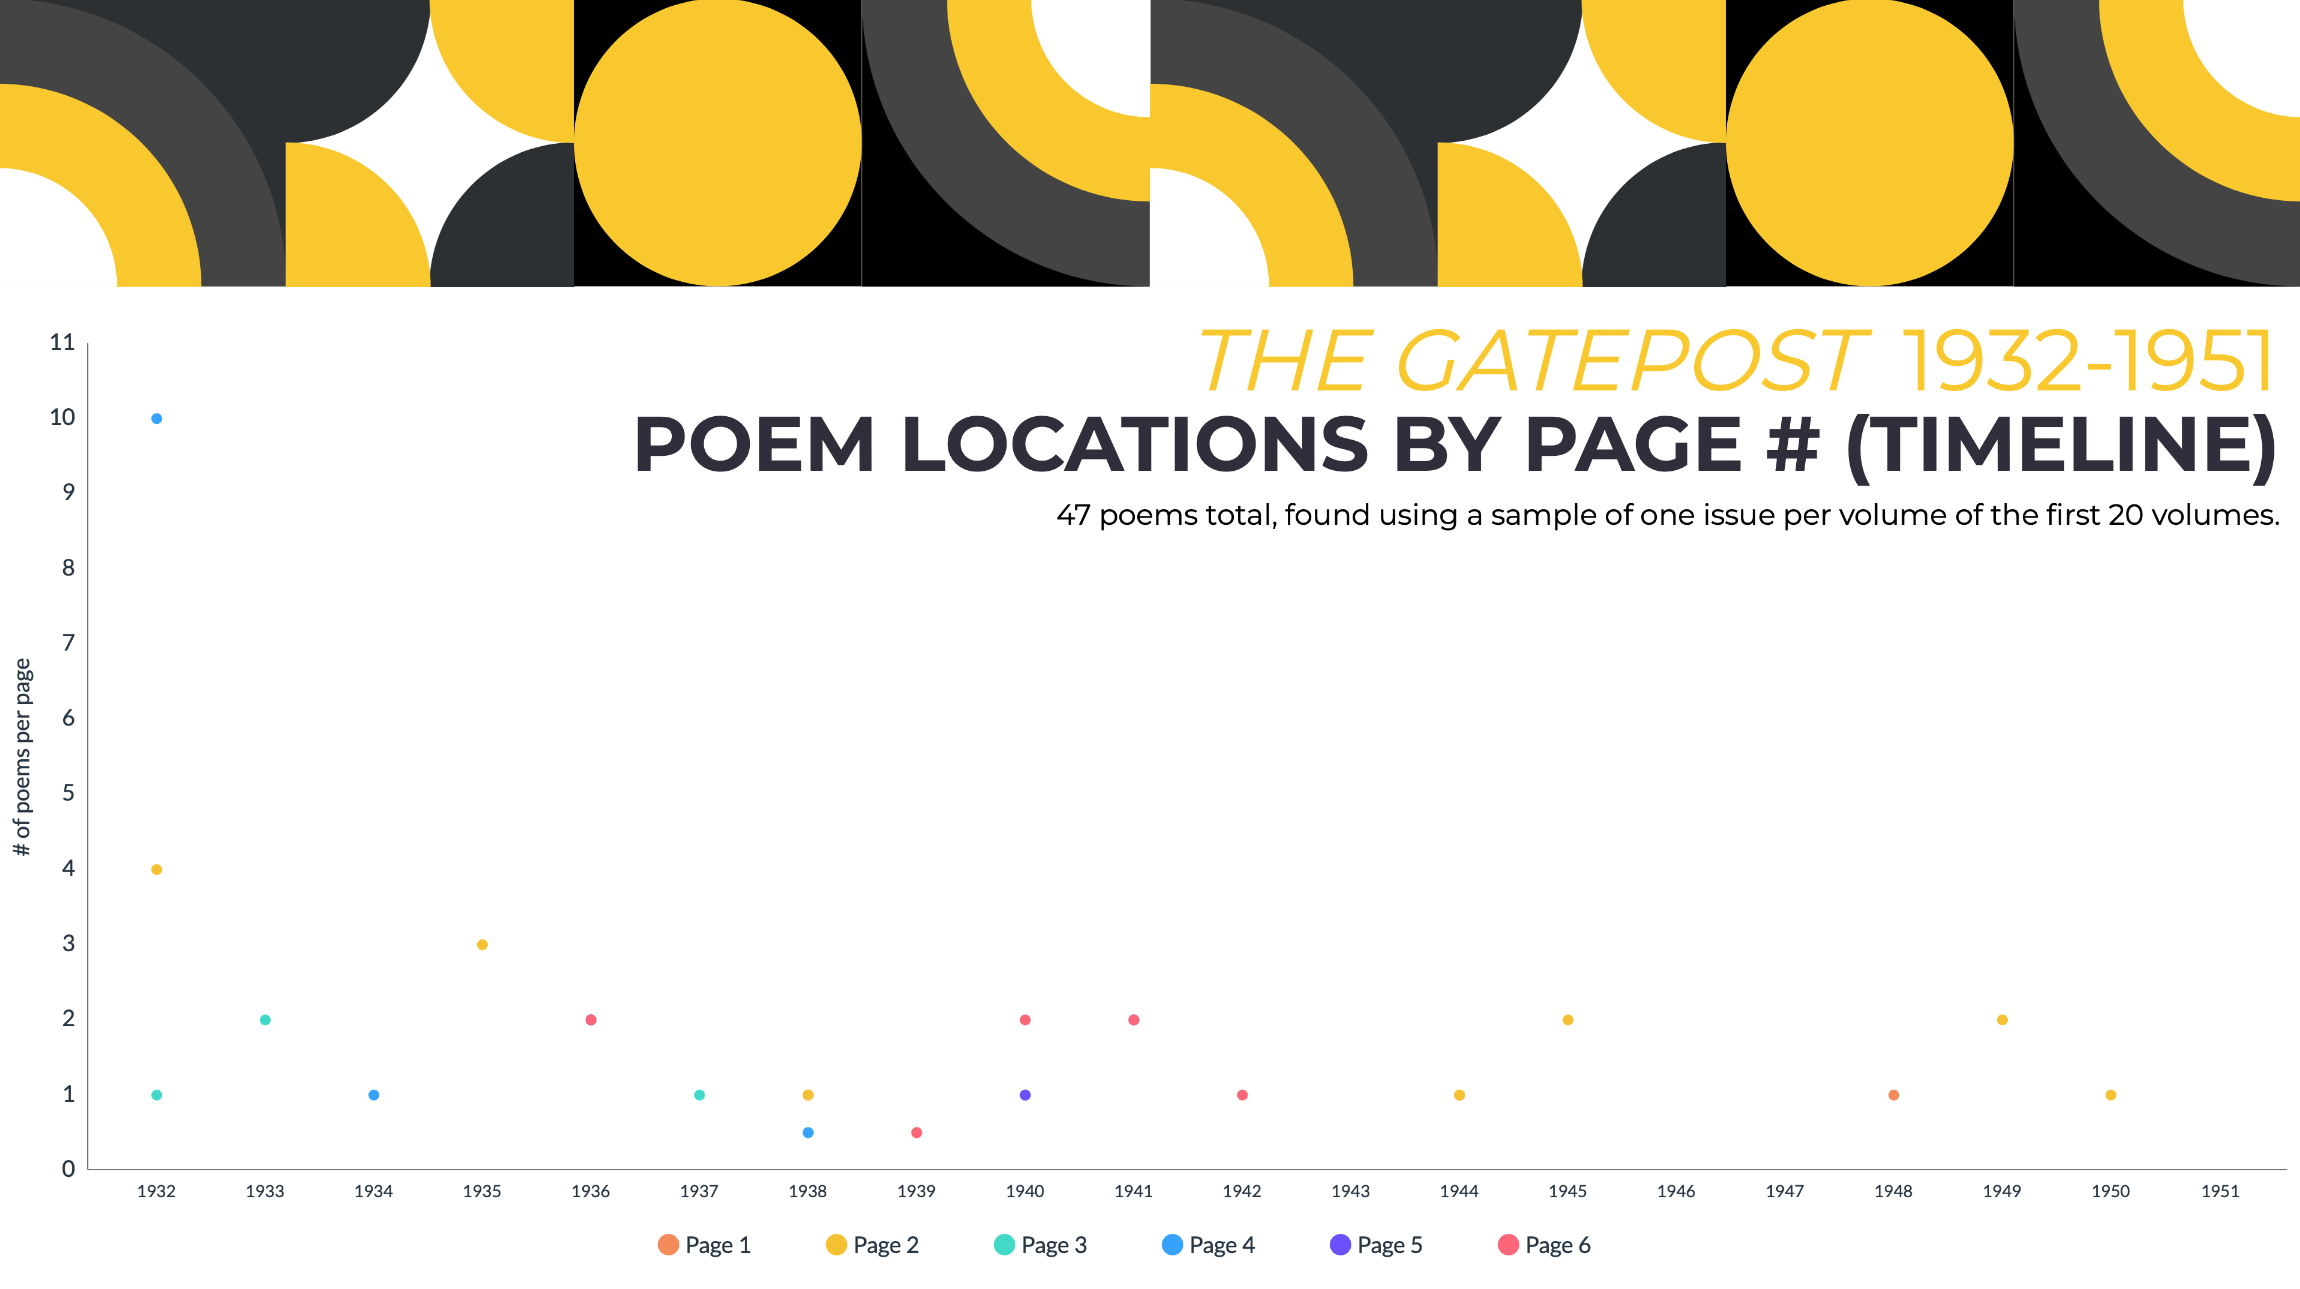
A scatter plot depicting the number of poems and their page locations found in one issue per volume of the first 20 volumes of FSU's The Gatepost newspaper. The values on the x-axis refer to the year each referenced issue was published, and the values on the y-axis indicate the number of poems found. The colors of the dots correspond with specific page numbers, as indicated in the legend at the bottom. This graph was created as part of an analysis of poetry in The Gatepost for a DGHM 110 final project.
Creator
Rain Cormier '24
Date Created
05-11-2022
Source
Created using Visme.com.