-
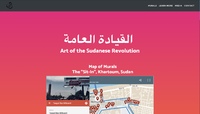
A map of murals that were created during the "Sit-In" in Khartoum, Sudan or restored afterwords
-

Recovering forgotten English plays from 1570-1642 and making them accessible to the public.
-
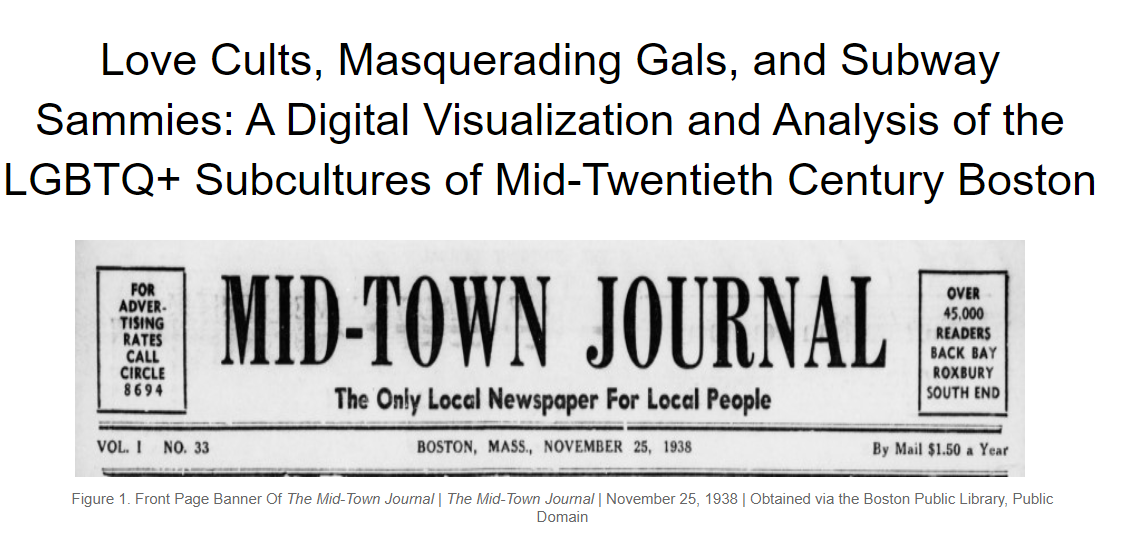
It is a digital humanities project with a focus on the queer community of Boston from 1940s-1960s. It has maps, bar graphs, snippets of newspaper articles of the queer community, testaments from queer people themselves etc. This resource breaks down misconceptions about the queer community, raises awareness about the queer experience and identity, as well as gives a historicity of the queer community.
-
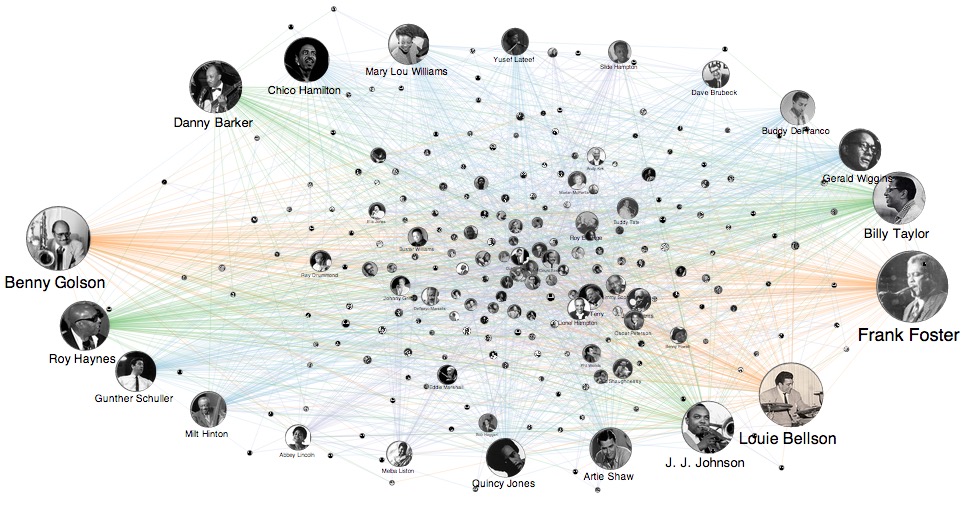
Linked Jazz is a website where you can learn about Jazz musicians and their connections to each other.
-
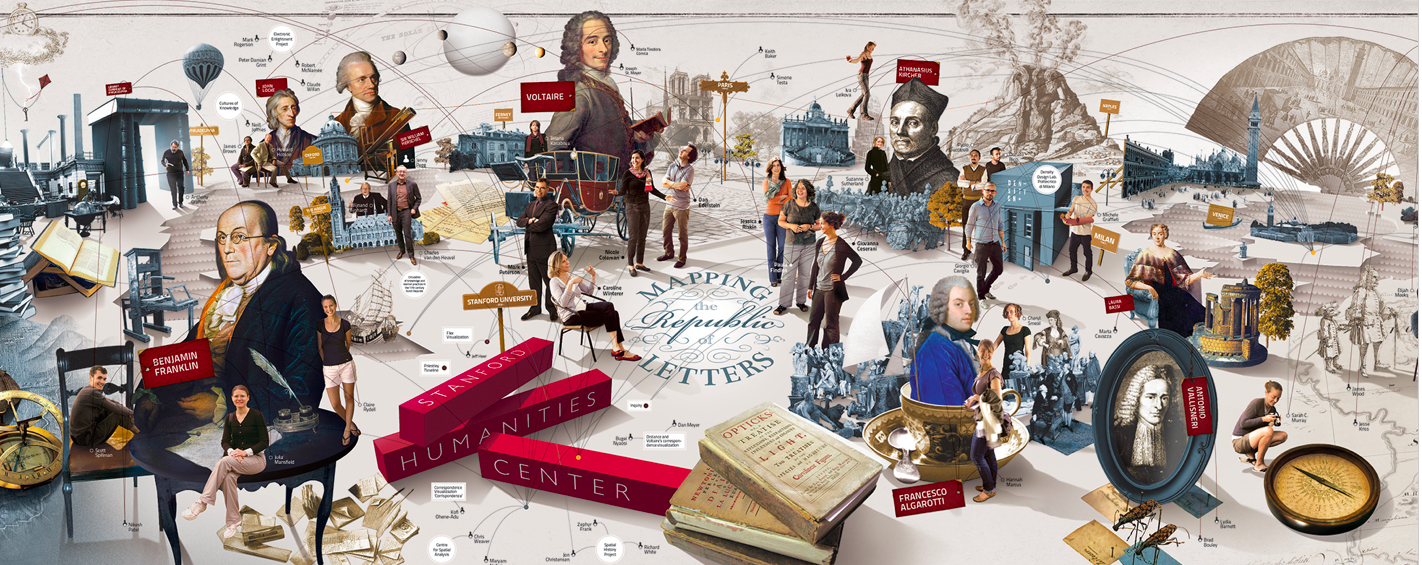
Create interactive visualizations of different corresponding networks throughout history and using them to create case studies.
-

A Frankenstein Atlas explores Mary Shelley's novel Frankenstein from a spatial perspective. Inspired by research and theoretical approaches in literary mapping and historical geography, A Frankenstein Atlas provides scholars and students with a platform to study and experiment with Shelley's text.
-

A website that discusses the recorded history of LGBTQ+ people in Boston.
-

This is a scholarly collaborative website where people can add lost plays that've been recovered in England through 1570-1642.
-
-
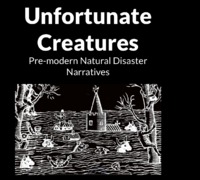
The peer-reviewed crowd-sourced site Unfortunate Creatures is devoted to making available primary sources reacting to natural disasters in the pre-modern period. Developers invite collaborators, including faculty and mentored undergraduate scholars to contribute. 
-

This Archive talks about the diversity of the LGBTQ+ culture that existed in the twentieth century of Boston. It includes articles, newspaper clippings, journal entries, and historical records.
-
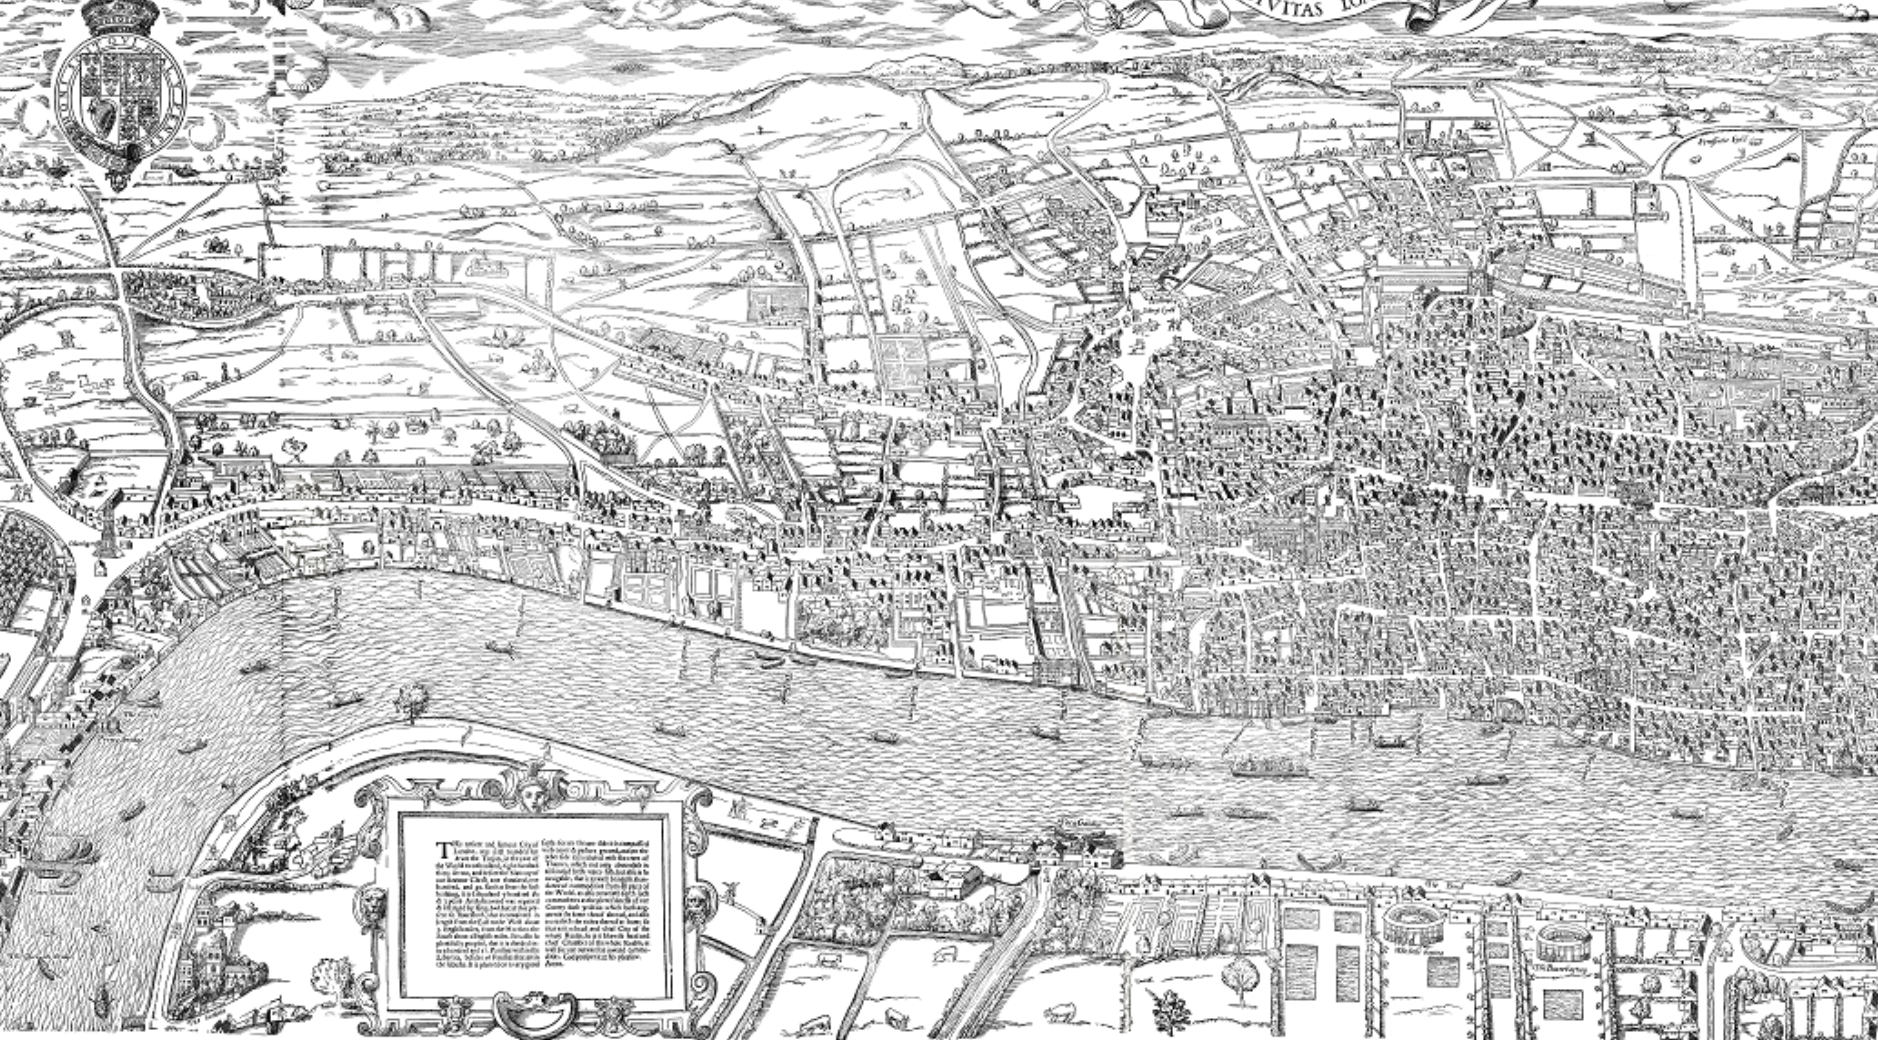
The Map of Early Modern London (MoEML) recreates sixteenth- and seventeenth-century London with all its churches, markets, bookshops, neighborhoods, gates and halls, and it does so with a large and detailed maps combined with primary source materials describing or depicting London at the time.
-
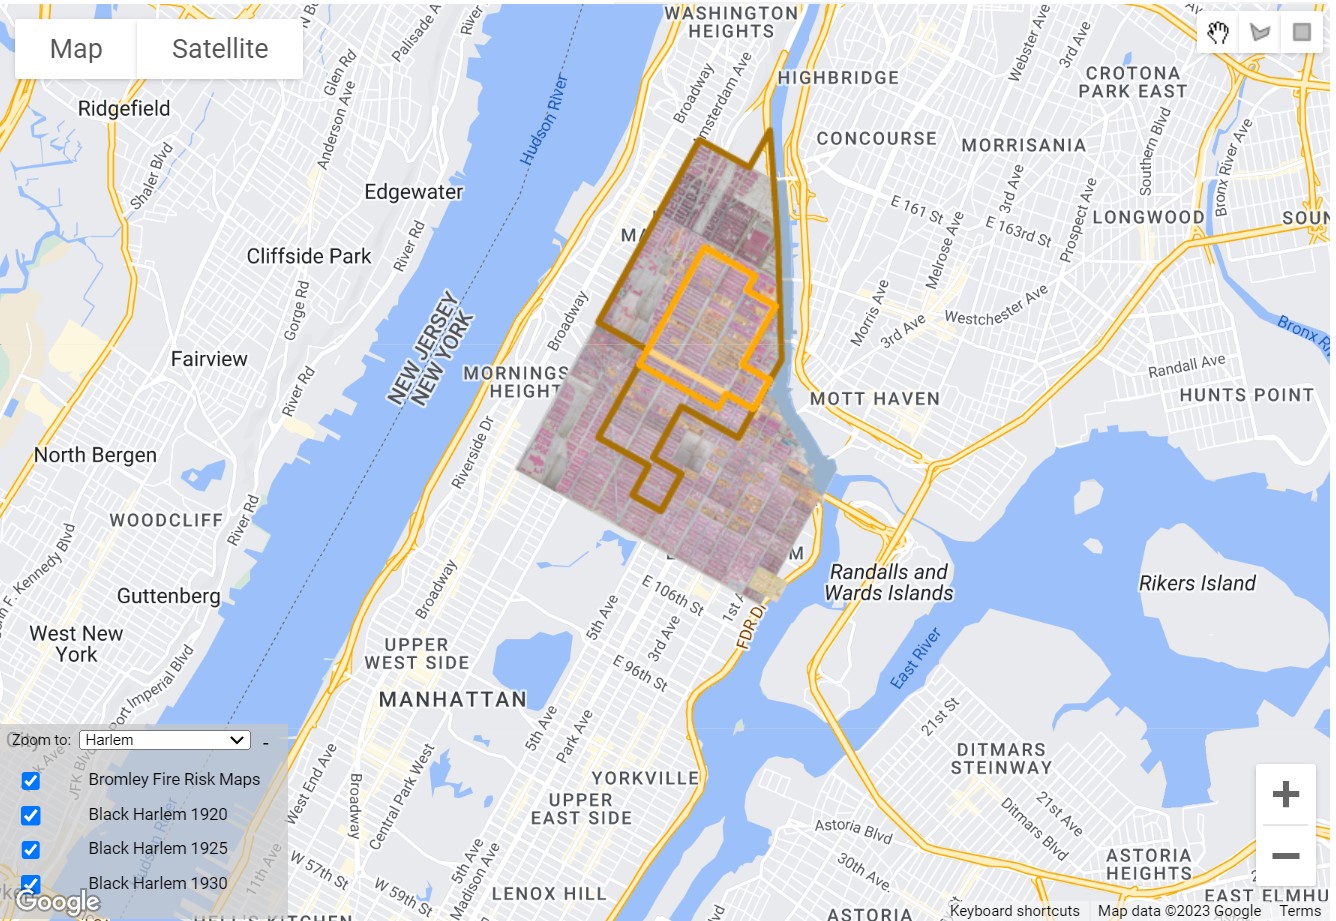
A website created to document happenings in Harlem from 1915 to 1930. Includes events such as sports games, crimes, nightlife, and churches. The interactive map lets you see the expansion of “Black Harlem” and visually presents other information along with detailed descriptions and timelines.
-
The website has who, what, where, and how many when talking about Black people in the mormon church. they have many people that have worked on this site. They have got two awards. one in 2021 and the other one in 2022. Lastly, this site shows the history of black people who became mormon and the church.
-
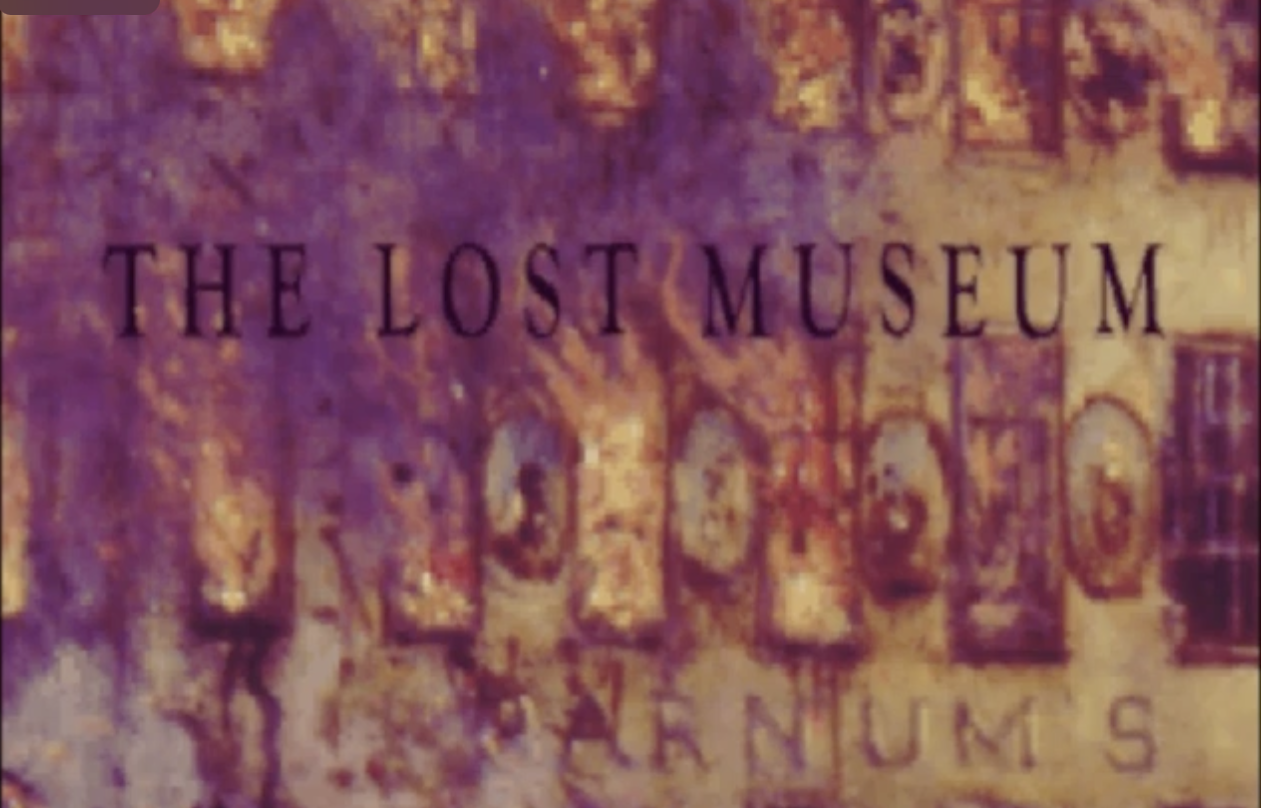
The video explains through descriptive audio and pictures how Barnum's American Museum opened in 1841 in New York City, in no time became the most visited place in America but was destroyed in July 1865. It then shows the effects of this damage through animated pictures, music, and no descriptive audio.
-
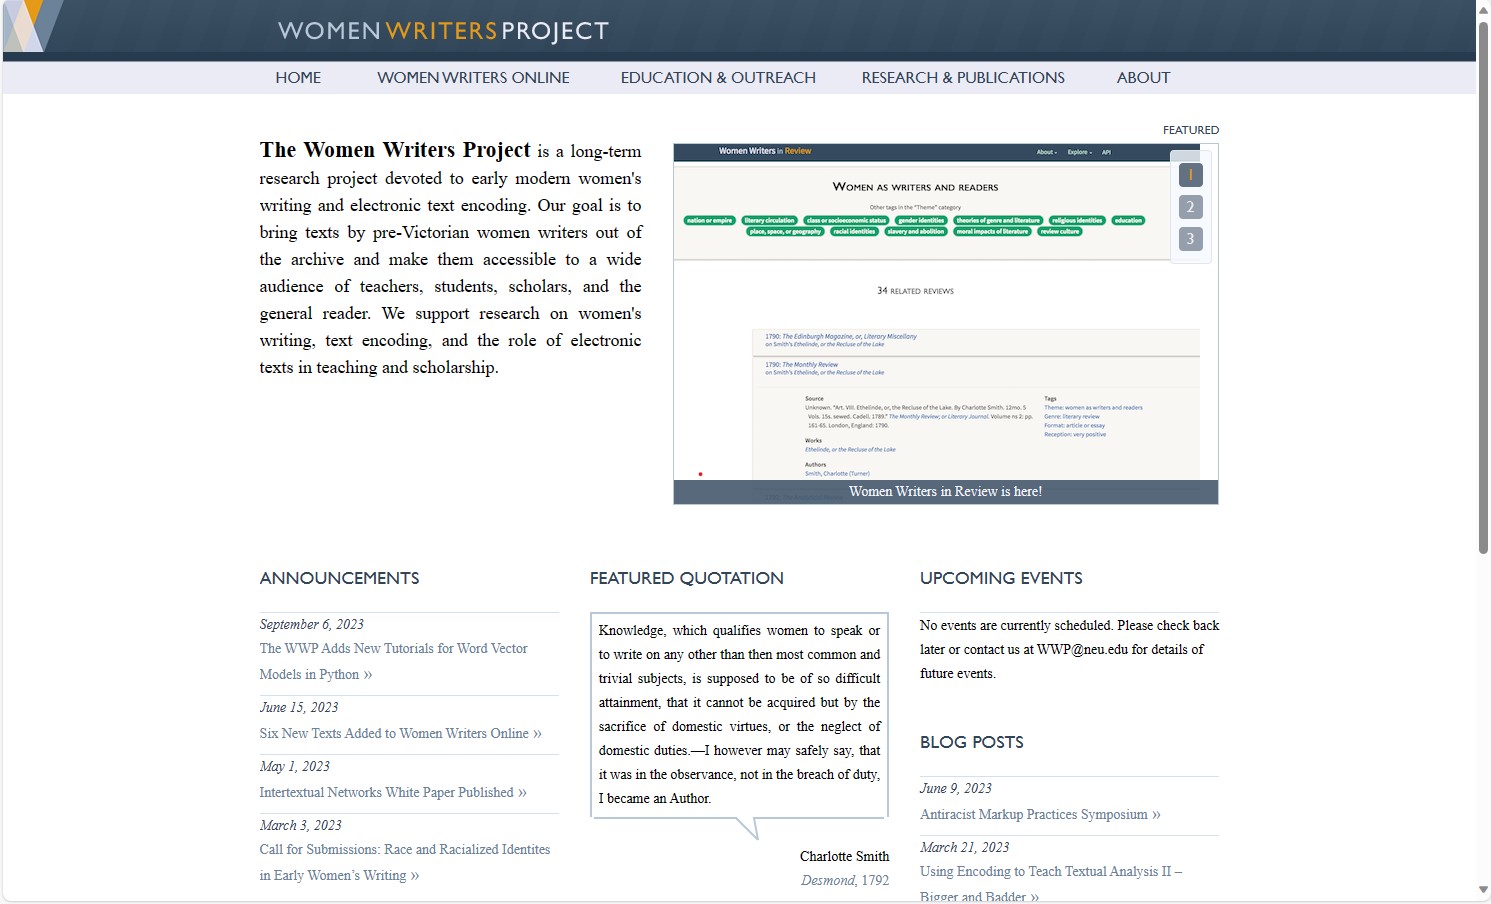
The goal of the Women Writers Project is to revisit pre-Victorian texts, written by women. The research project dedicates itself to text encoding, accessibility to a variety of audiences, and electronic texts.
-
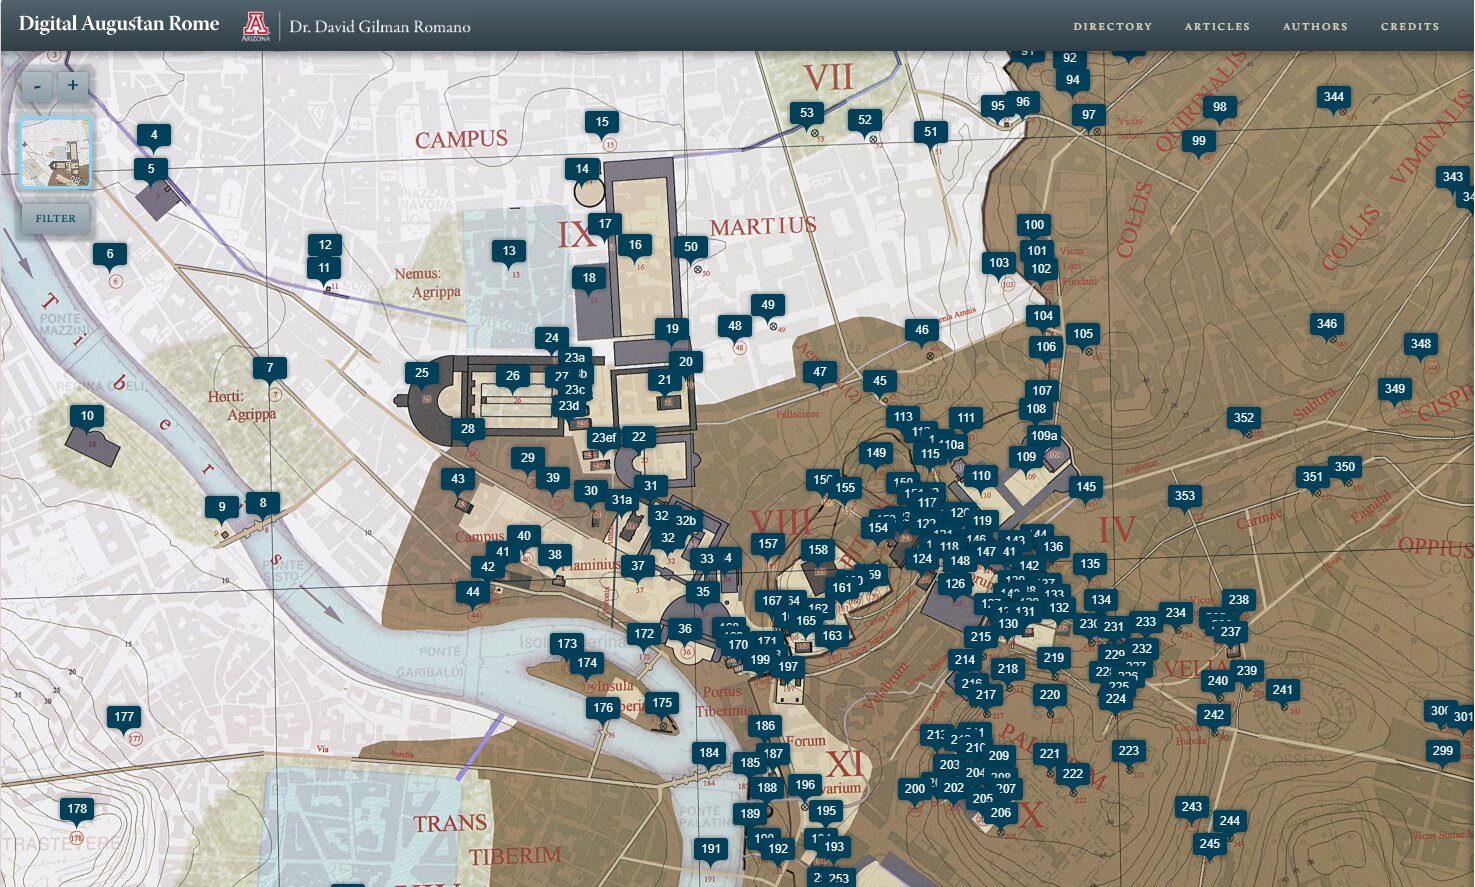
It is a digital interactive map of Augustan Rome, when you click on certain highlighted spots on the map, you can access information about the location during A.D. 14. There are a few articles about the time period and a directory that can be used for easier access to a specific location. There's also an option to filter by physical feature types.
Description - It is a digital interactive map of Augustan Rome, when you click on certain highlighted spots on the map, you can access information about the location during A.D. 14. There are a few articles about the time period and a directory that can be used for easier access to a specific location.
-
The Bomb Sight maps the London WWII bomb census, taking place between 07/10/1940 to 06/06/1941. It has a detailed satellite map with red dots placed on the locations that bombs were dropped on London, with zoom in/zoom out functionality. It also contains divisions based on specific neighborhoods, bomb totals for each neighborhood, specific locations of each bomb, location searching, and data for the first night of the Blitz, a weekly bomb census, and an aggregate bomb census. It allows users to visualize and contextualize the frequency of the bombs dropped on London in World War II, as well as determine which parts of London were bombed more than other parts of London. -Sofia Wilson
-
It’s a WordPress website that hosts information about St. Pauls cathedral in 1622, including sermons of the priests for special occasions. It includes digital images of the cathedral as well as a “digital flyby” of the site. The website also includes information about acoustics and the historical context of the cathedral.
-

The website contains both primary sources (trial transcripts, evidence, photographs, testimonies, personal documents, maps, arrest warrants, etc.) and secondary sources (summaries, timelines, biographies of those involved, videos of reenactments, etc.) having to do with famous historical trials. The website informs viewers of various famous trials throughout world history in the years from 399 BC to 2021.
-
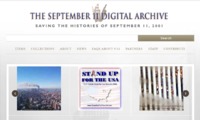
The September 11 Digital Archive uses digital media to collect, preserve, and display the history of the terrorist attacks on the United States of America in 2001. It consists of first-hand accounts, emails, phone calls, text messages, photos, and songs that help piece together the timeline of events.
-
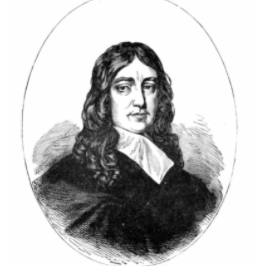
This site aims to be a complete and annotated archive of John Milton’s works (poetry and some prose).
The reading room offers poetry (Paradise Lost, Paradise Regain'd, Samson Agonistes) as well as prose and epigrams in Latin. For those works in Latin, the site offers translations.
-
Baldwin’s Paris is an interactive map with pinpoints of James Baldwin’s alluded to locations throughout the city of Paris. The markers on the map show exactly where these locations are mentioned in 10 of his published works and it has the specific quotations of these references.
-
An interactive map that pinpoints each instance that an individual was killed by a police officer in 2020. The map also notes that so far in 2021, 745 people have been killed. Each pinpoint can be clicked on to view information about the killing and sources to support. There are several other charts and graphs that track police brutality over the years. Other tabs allow the viewer to compare data between cities and states and view national trends. One may also read extensive information on how the data was collected and why it is important to continue to investigate police officers.
-
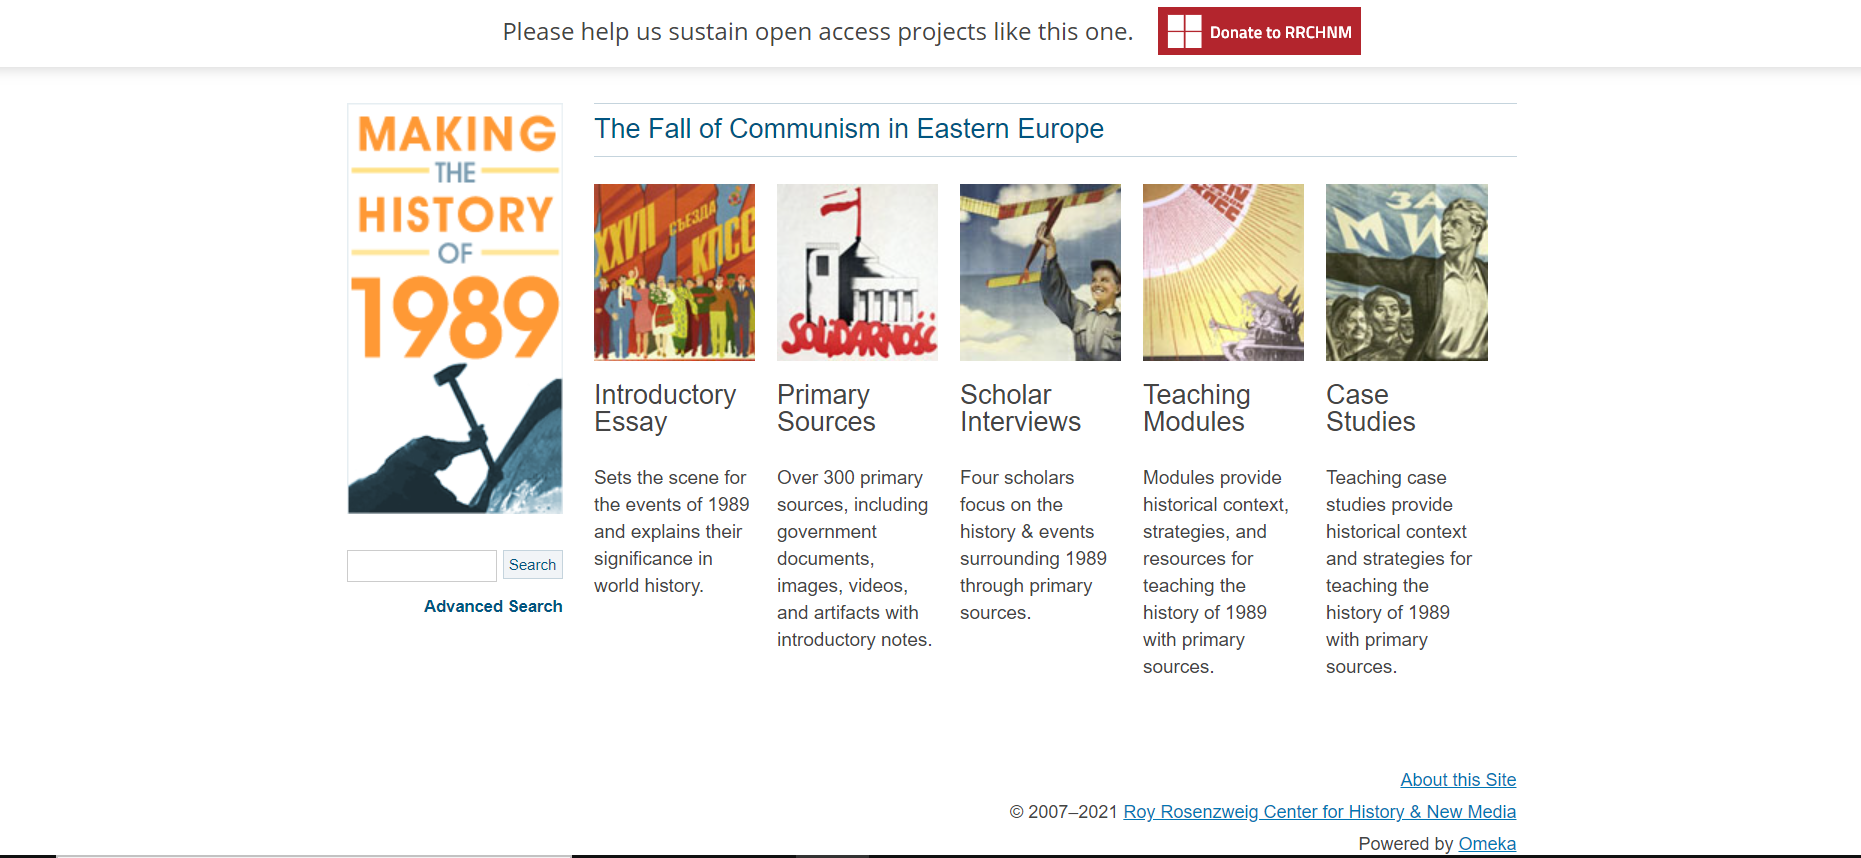
What is it?
Making the History of 1989: The Fall of Communism in Eastern Europe utilizes Omeka to highlight the events leading up to the fall of the Berlin Wall in 1989 and the decline of Communism in Eastern Europe.
What does it have?
The website showcases primary sources (such as propaganda posters, government documents and videos), scholarly interviews and essays from the years leading up to 1989 to provide context and information about the fall of Communism. The site also has case studies analyzing specific sources, such as Soviet health posters, as well as detailed lesson plans and teaching modules for classroom use.
What does it do?
The site provides various resources to understand political, social and cultural contexts within Eastern Europe that contributed to the fall of Communism, as well as providing numerous lesson plans for teachers to use.


