Poetry of The Gatepost
by Tara Cormier
Using a sample size of one issue per volume, this project tracks the frequency, placement, and sources of poems that were published in The Gatepost between 1932-1951. My goal is to determine the popularity of poetry at Framingham Normal School during these years, and to draw tentative conclusions as to why these trends may have occurred. Each issue that was analyzed was published in March (except for one outlier published in April, it was the only one available for this project). This was done to maintain a sense of uniformity, and because I hypothesized that there would be more interest in poetry as spring approaches. I can’t definitively say whether I was correct about this without analyzing issues from other seasons, but 19% (9/47) poems were about springtime!
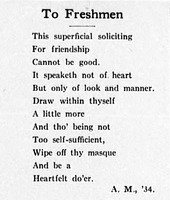
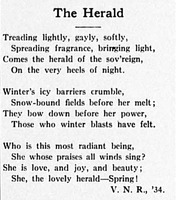
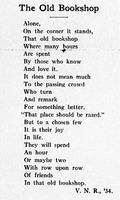
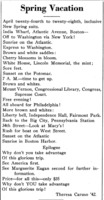
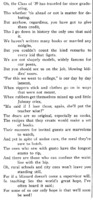
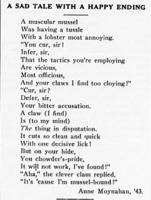
On this page, you will find several graphs and visualizations that were made with the data I collected. Below those are a selection of 11 poems that were analyzed, all authored by FSU students and alumni (the remaining 36 can be found in the Poetry in The Gatepost, 1932-1951 item set).
Higher resolution versions of all images are available by following the embedded links and clicking the image to view it in its original size.
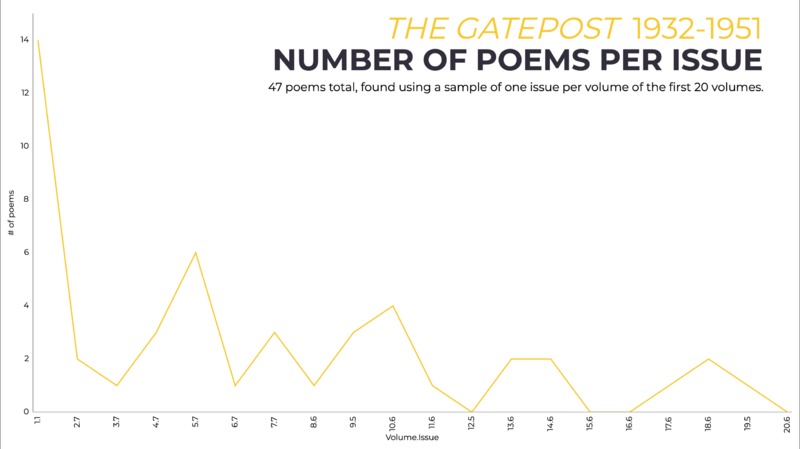
Gatepost Poems Per Issue: 1-20 Line Graph
A line graph depicting the number of poems found in FSU's The Gatepost newspaper, using one issue per volume from the first 20 volumes. The values on the x-axis refer to the volume and issue being referenced, and the values on the y-axis indicate the number of poems that were found. What is most obvious about this graph is that the first issue (Vol.1.1) is a significant outlier, containing 14 poems across 4 pages (all other issues have 6 pages). Overall, the quantity of poetry published in The Gatepost trends downwards as the years go by.
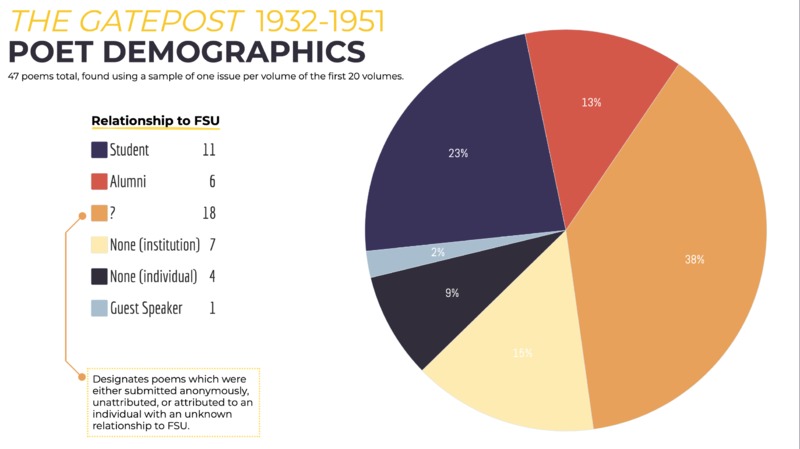
Gatepost Poems By Author Demographic: 1-20 Pie Graph
A pie graph depicting the demographics of authors who have submitted poems to The Gatepost newspaper, using one issue per volume of the first 20 volumes. The demographics include (then) current students, alumni, poetry sourced to institutions with no known relationship to FSU, poetry sourced to individuals with no known relationship to FSU, poets who were guest speakers at FSU, and a mystery category which includes poetry with no attributed author or whose author may or may not have a relationship with FSU. For this last category, further research is required.
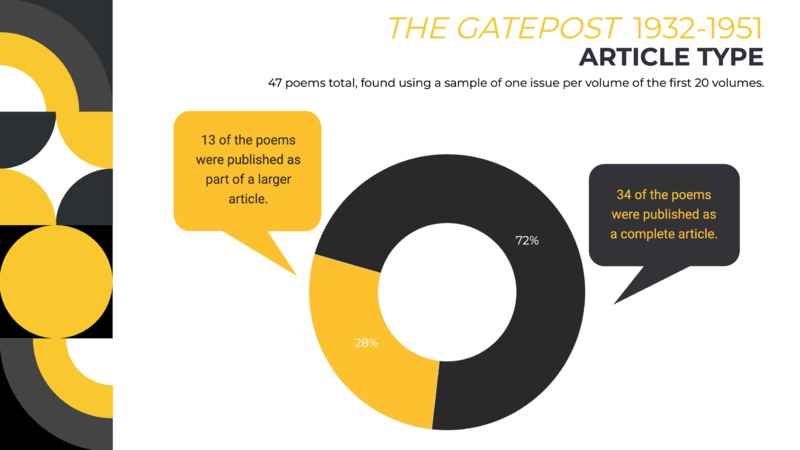
Gatepost Poetry Article Type: 1-20 Disc Graph
A disc graph depicting the two methods of publishing poems (quoted in a larger article or published as a standalone article) found in one issue per volume of the first 20 volumes of FSU's The Gatepost newspaper.
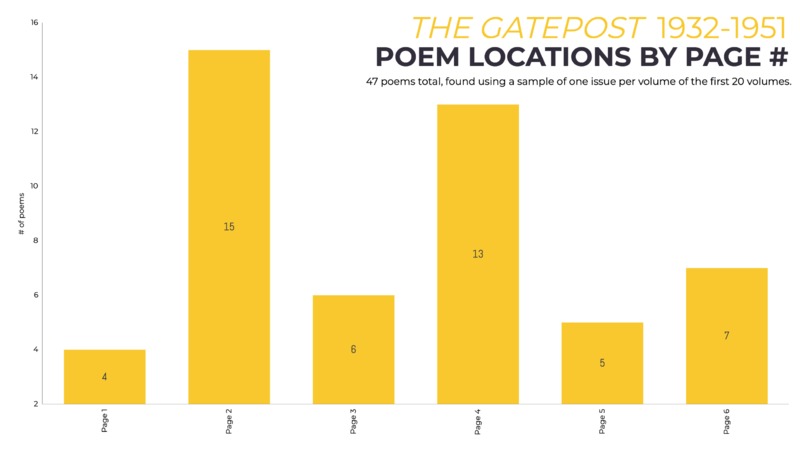
Gatepost Poems by Page Number: 1-20 Bar Graph
A bar graph depicting the number of poems found by page location, using one issue per volume of the first 20 volumes of FSU's The Gatepost newspaper. The values on the x-axis refer to page numbers which contained poetry, and the values on the y-axis indicate the number of poems found across all 20 issues. I (neither poet nor journalist) find it interesting that pages 2 and 4 contain significantly more poetry than the rest, but further research is needed to theorize why this is the case.
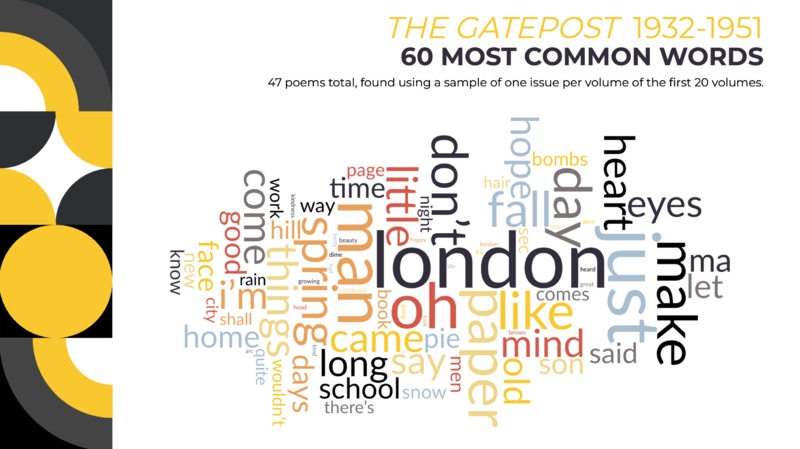
Gatepost Poetry Word Cloud: 1-20
A word cloud depicting the top 60 most commonly used words in poems found in FSU's The Gatepost newspaper, using one issue per volume from the first 20 volumes.
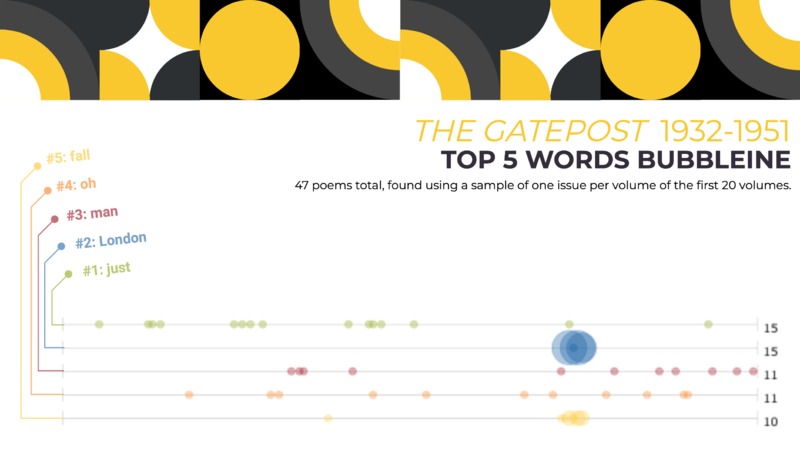
Gatepost Poetry Top 5 Words: 1-20 Bubbleine
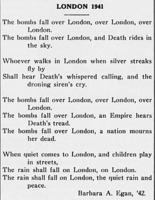
A bubbleine graph depicting the locations and frequency of the top 5 most frequently used words in poems found in FSU's The Gatepost newspaper, using one issue per volume from the first 20 volumes. Each line represents the text from all 47 poems, and each circle indicates the locations and concentrations of the color-corresponding word. Here, we can see another outlier- the word "London" is tied for first place with the word "just" for most uses across all issues. However, this graph shows that, while "just" is used in poems across many different issues, "London" is used many times in one poem (London 1941 by Barbara A. Egan '42, which can be found below). Without this graph, one might conclude from the word cloud above that London was a hot topic for Gatepost poetry (which may turn out to be true, pending further research).
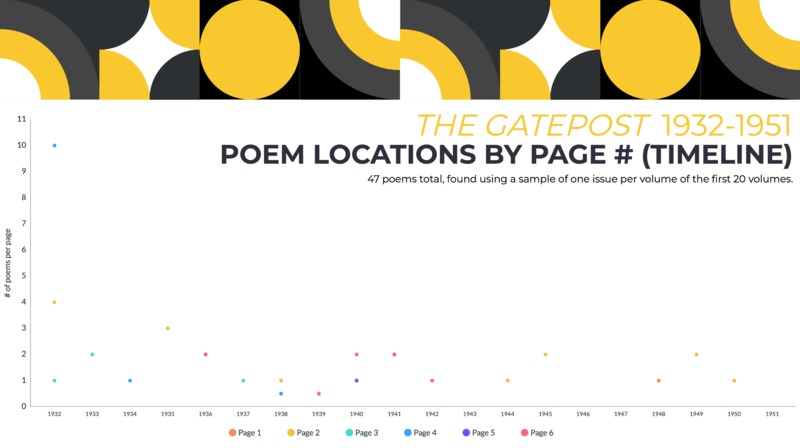
Gatepost Poem Frequency and Locations Timeline: 1-20 Scatter Plot
A scatter plot depicting the number of poems and their page locations found in FSU's The Gatepost newspaper, using one issue per volume from the first 20 volumes. The values on the x-axis refer to the year each referenced issue was published, and the values on the y-axis indicate the number of poems found. The colors of the dots correspond with specific page numbers, as indicated in the legend at the bottom. This graph is useful not only because it acts as a timeline which shows the relative frequency of poetry decrease from the 1940's on, but it also tells you the locations of poetry within each issue, which may speak to its importance during the given time period.
From these analyses, I can conclude that poetry was published in The Gatepost less as the years went by. The decrease in frequency is steady (excepting the first issue, which is an outlier), but most significant after 1941 (Vol. 11.6). Poems were most often featured on pages 2 and 4 of the newspaper, and were usually published as a standalone article rather than as an excerpt within a larger story. Not including poems authored by unknown sources, most poems were predictably submitted by current students. While these results are interesting and have confirmed and disproved several theories, more research is needed to make definitive conclusions about the culture of poetry at FSU during The Gatepost's early years.
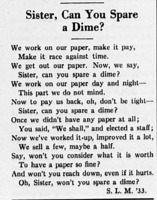
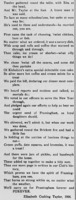
The Gatepost Vol. 11.6: "Twelve gathered round the table, with Rita at the head"
Elizabeth Cushing Taylor, '06